

Option contracts - are an arrangement entered between two parties where the buyer has the right but not the obligation...
Pricing of an Option - Most pricing models calculate the price of an option using some form of hedging such that the portfolio of the option...
Black Scholes option pricing equations for a European Call ( C ) and European Put (P)
Put-Call Parity - is a key zero-arbitrage concept in the options world which explains that the total payoff of taking opposite...
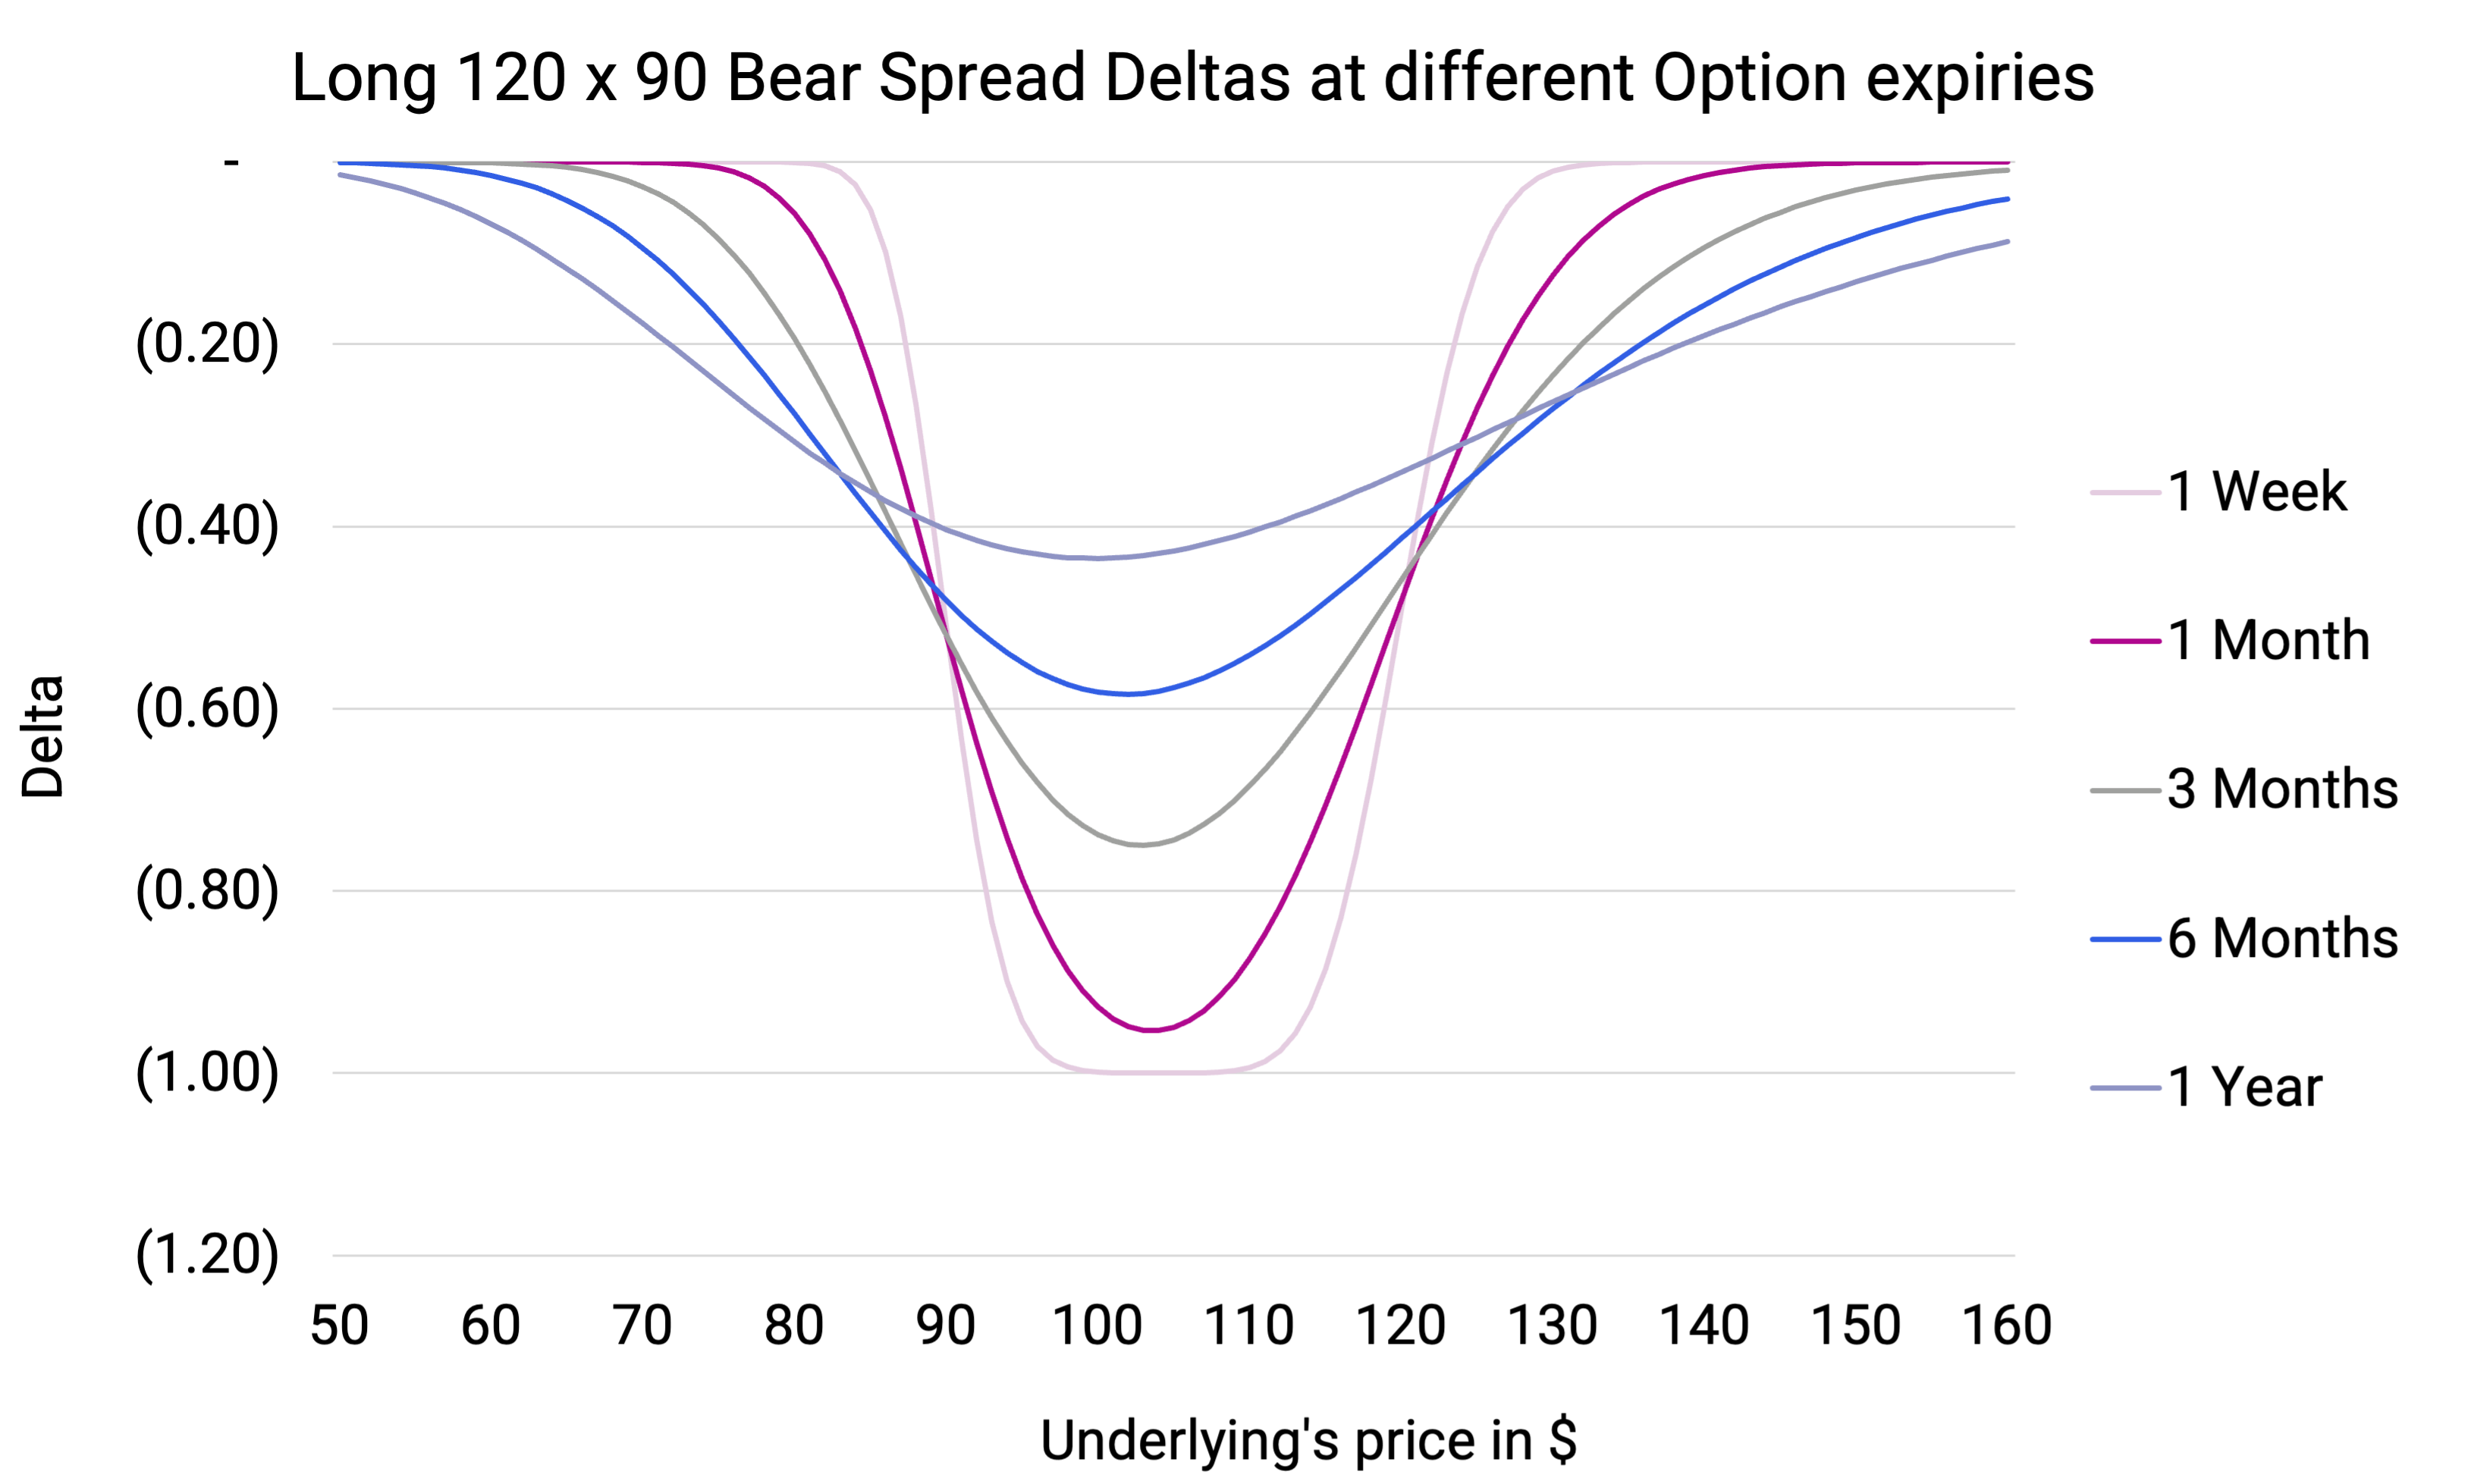
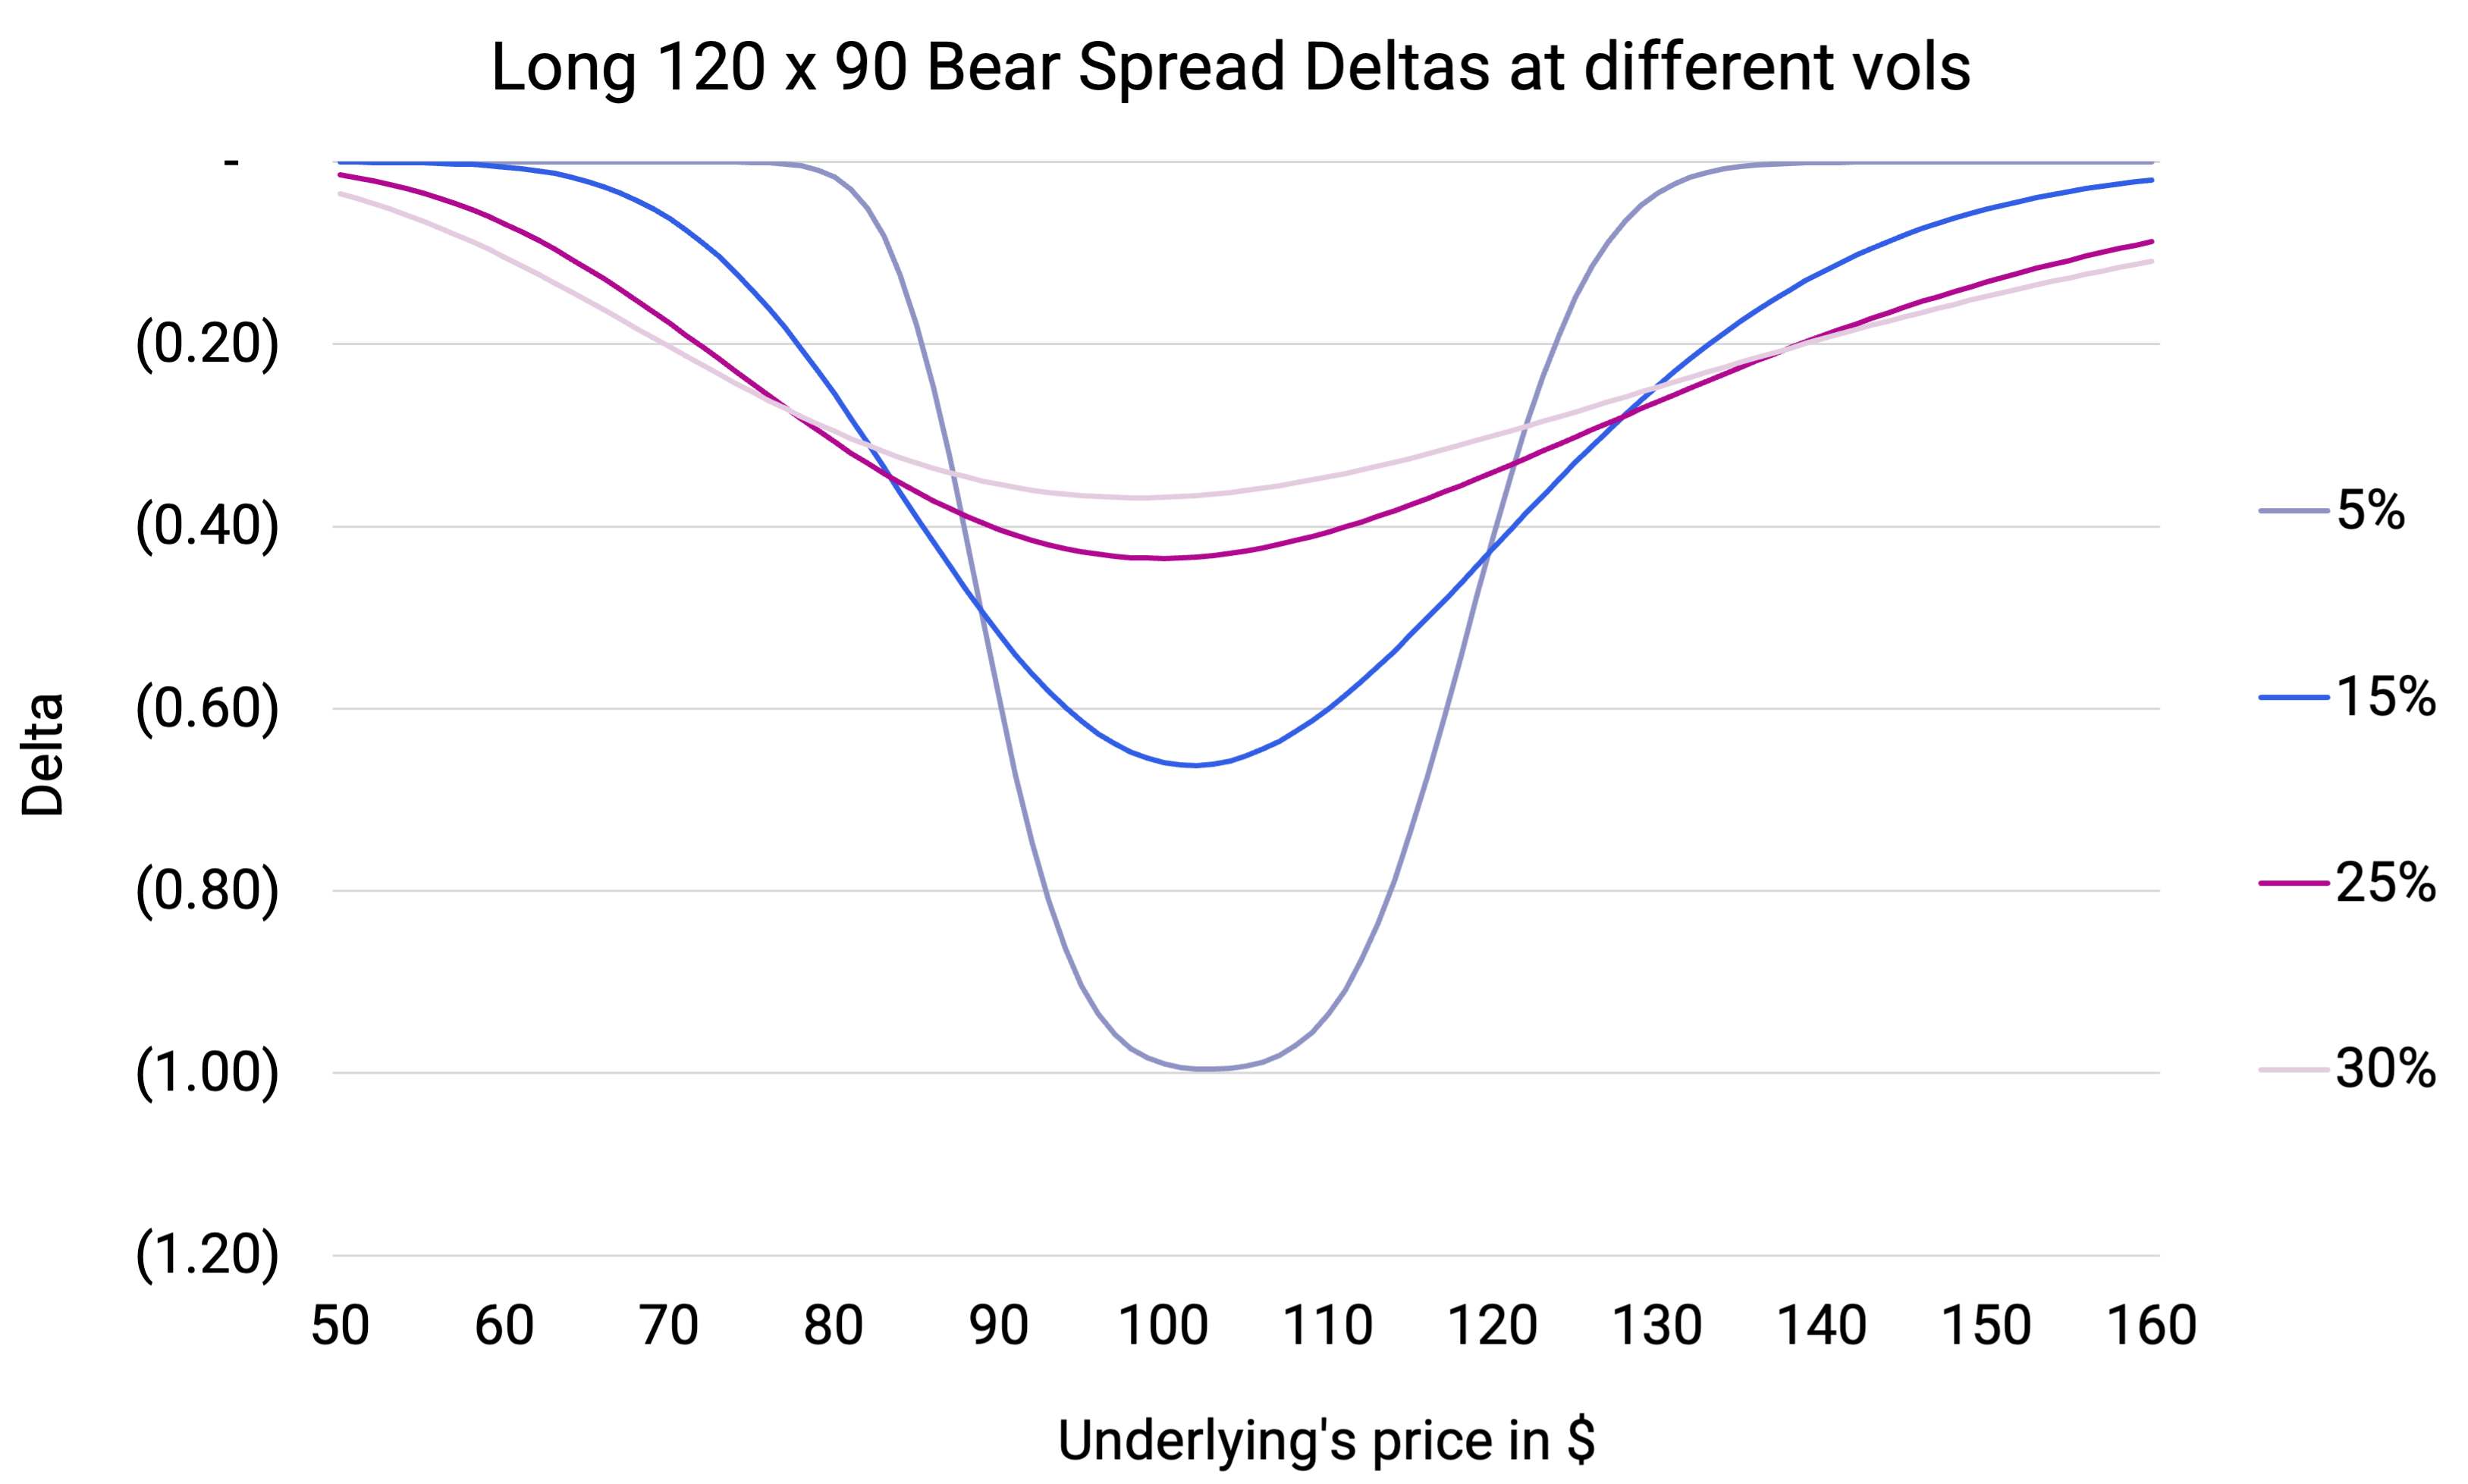
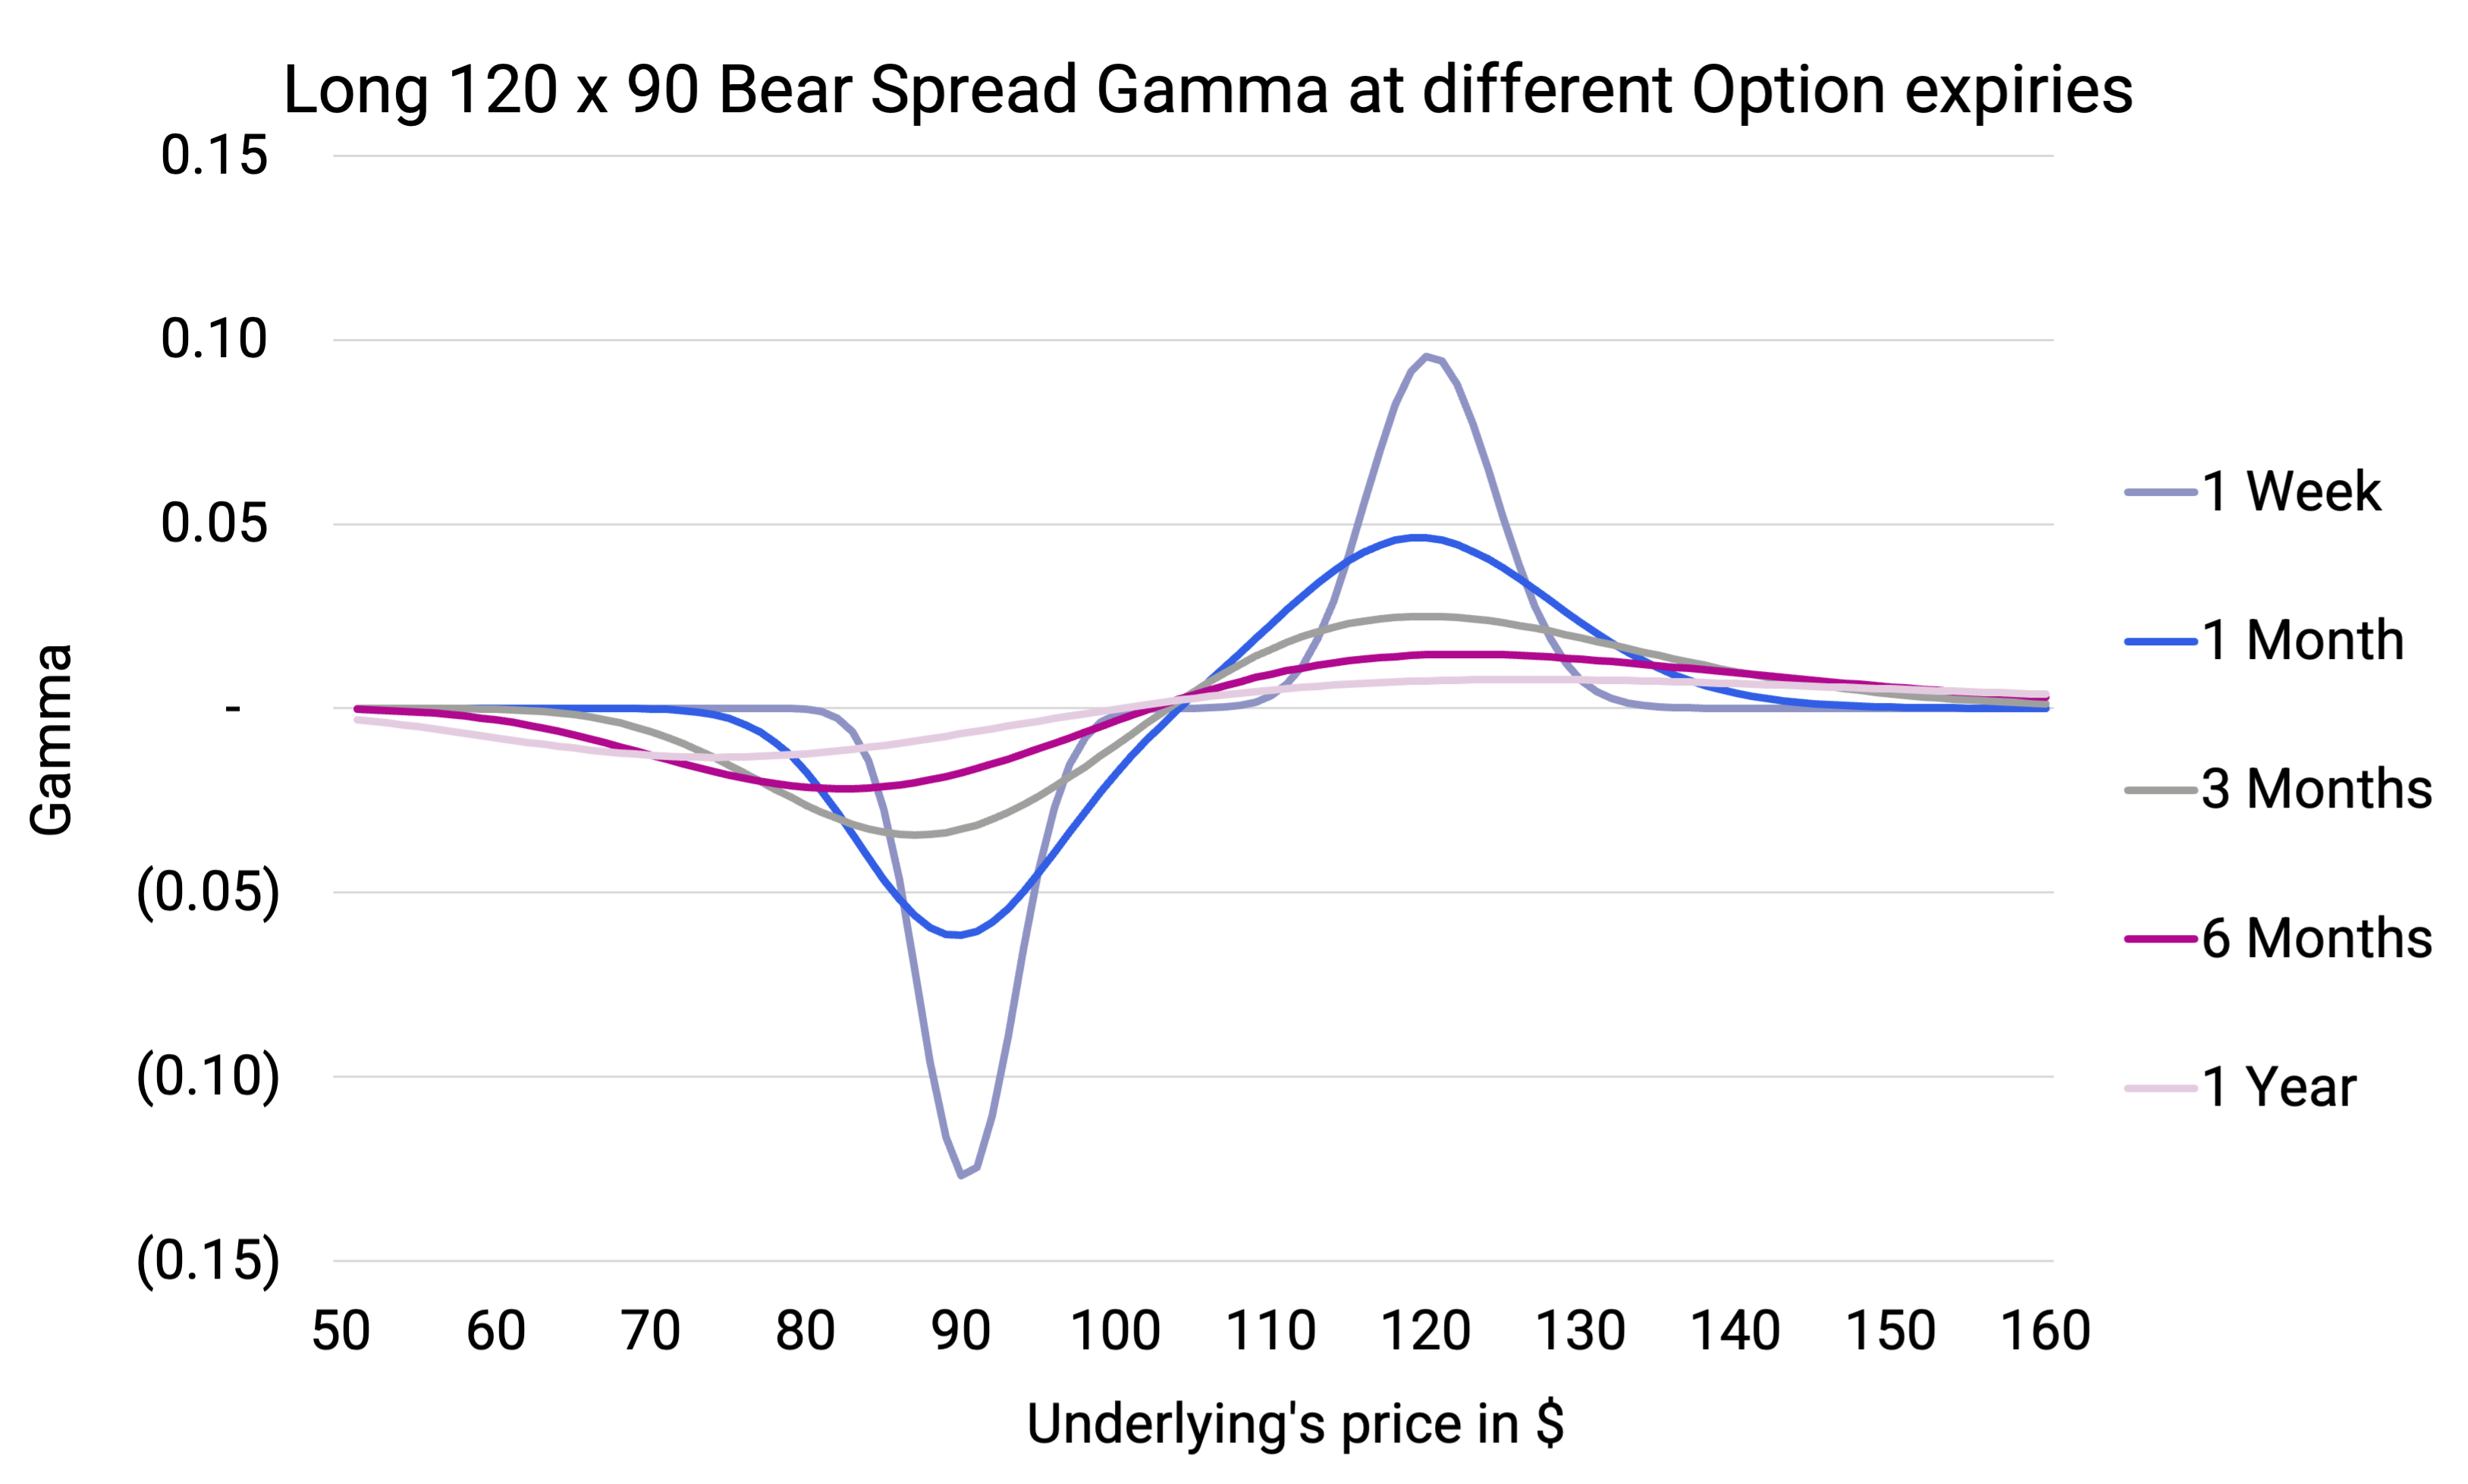
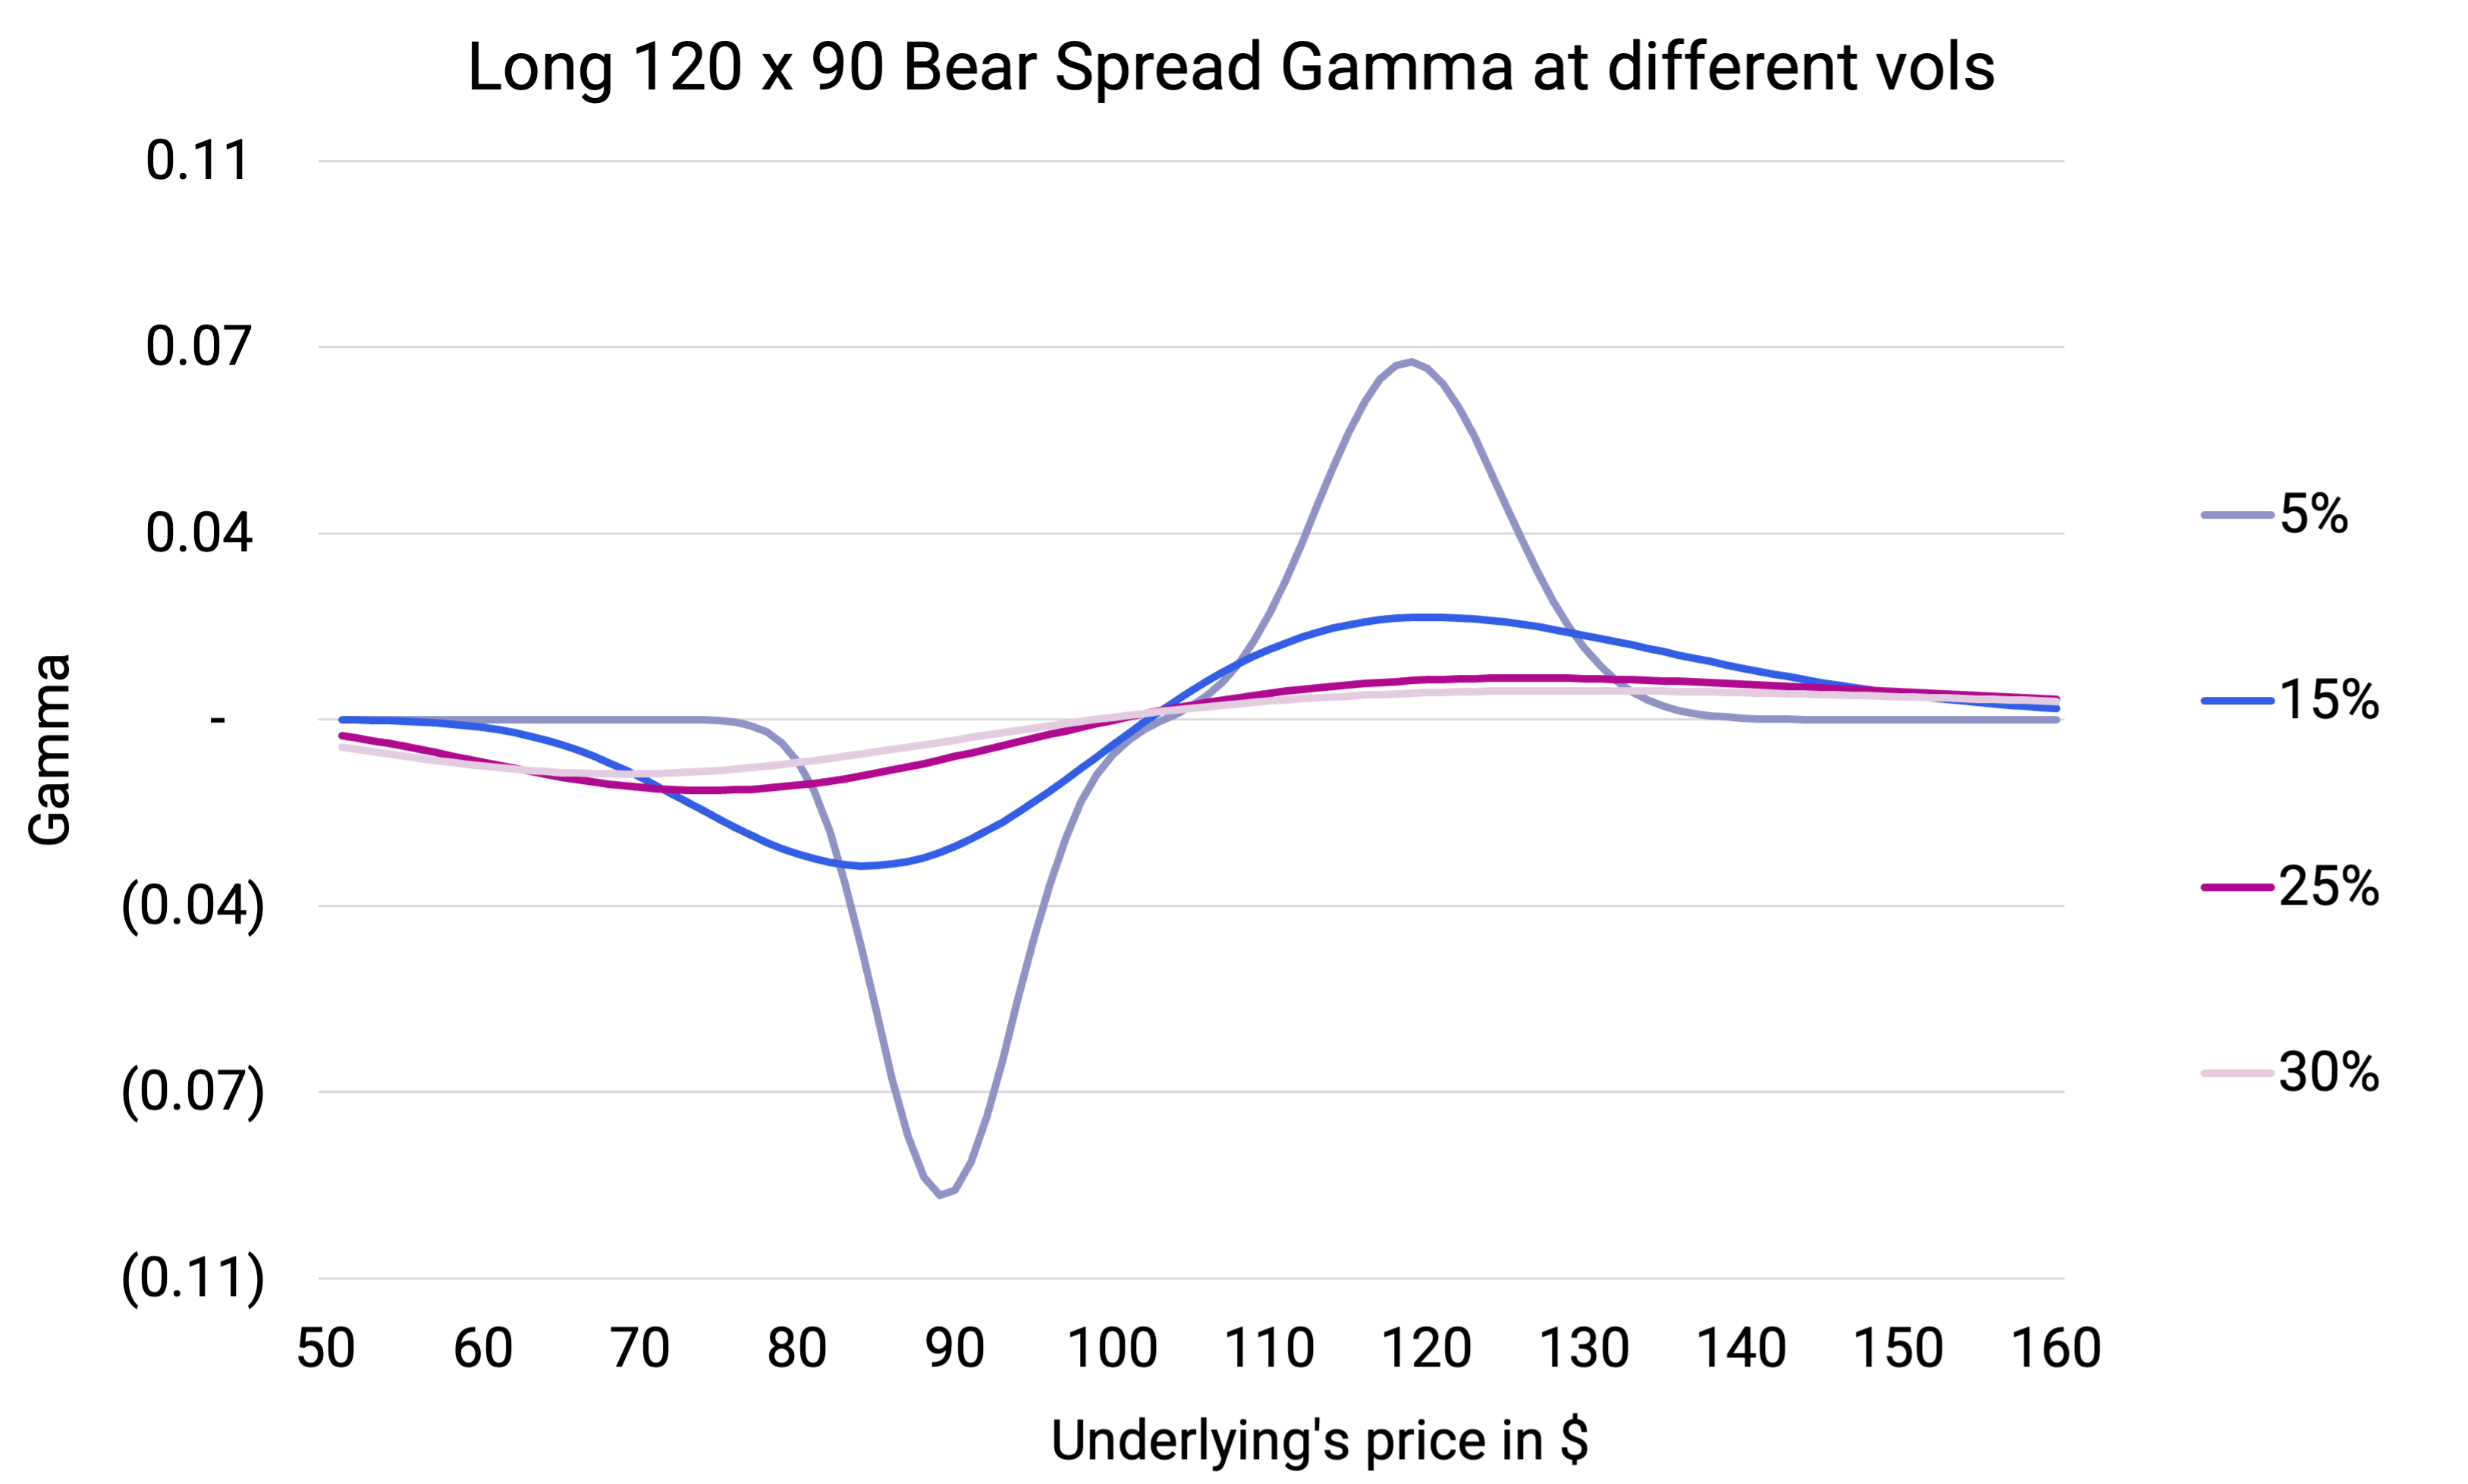
Option Greeks - risks embedded in an option contract that appear with movements in its variables and determine...
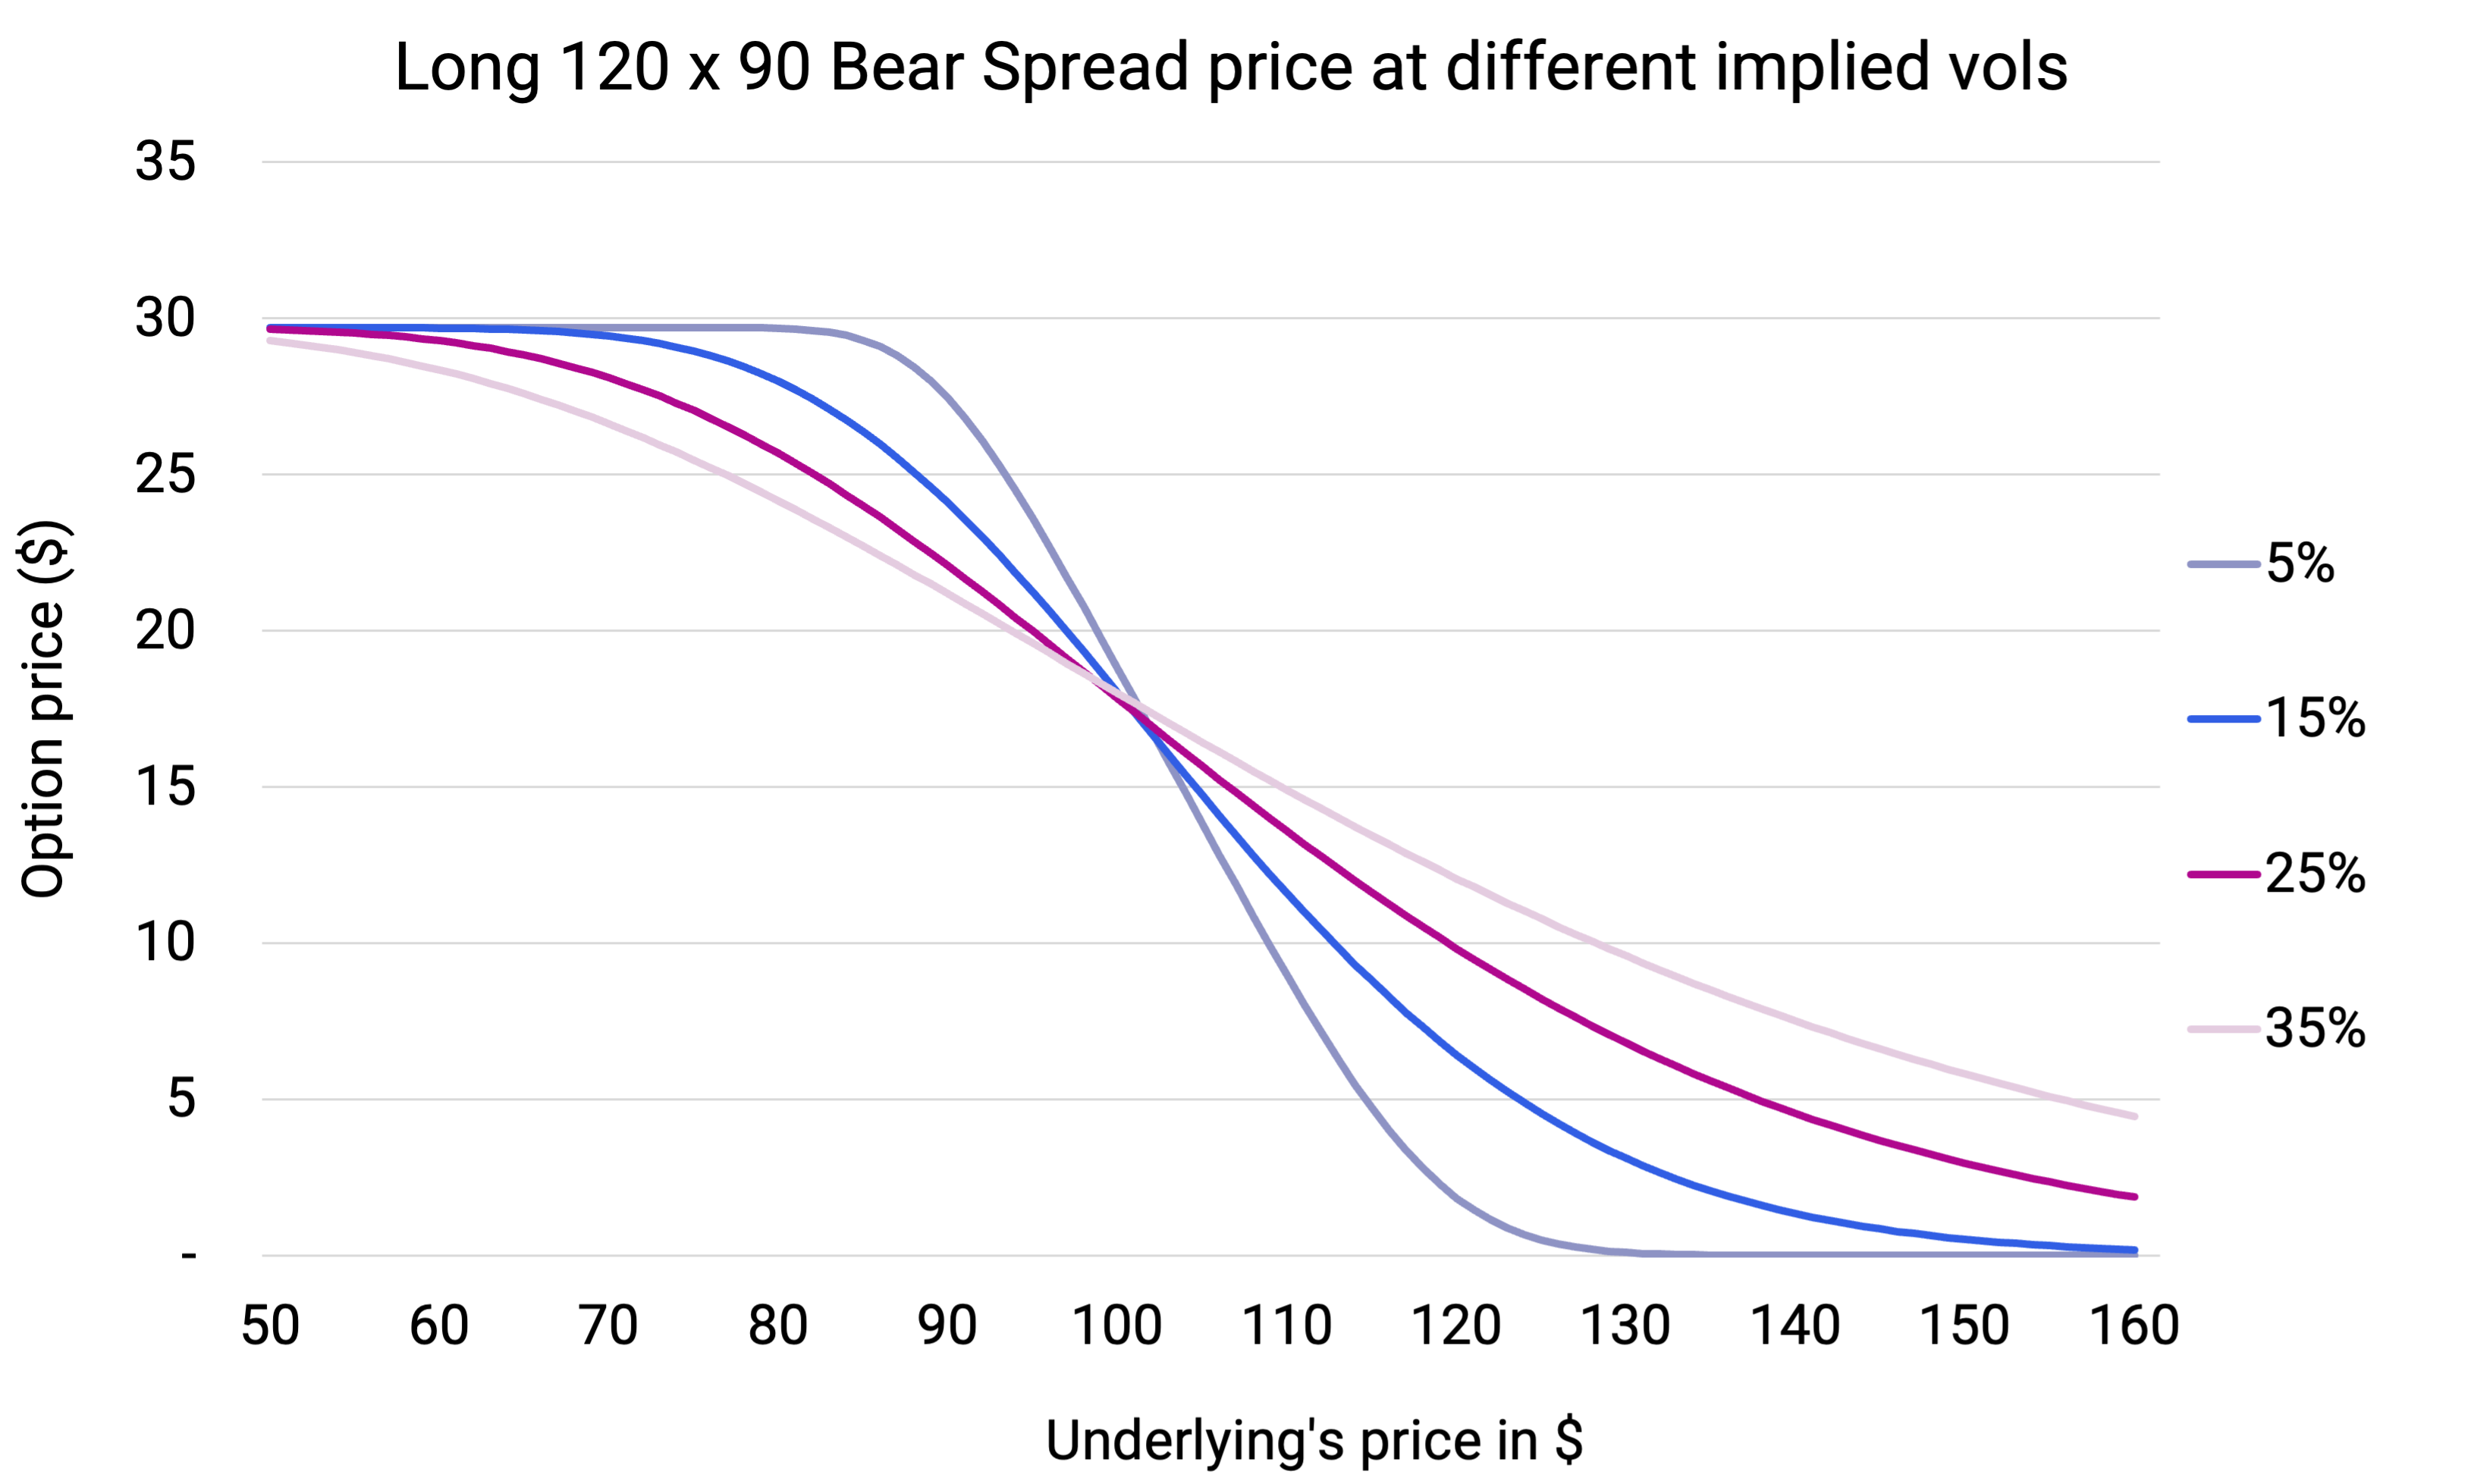
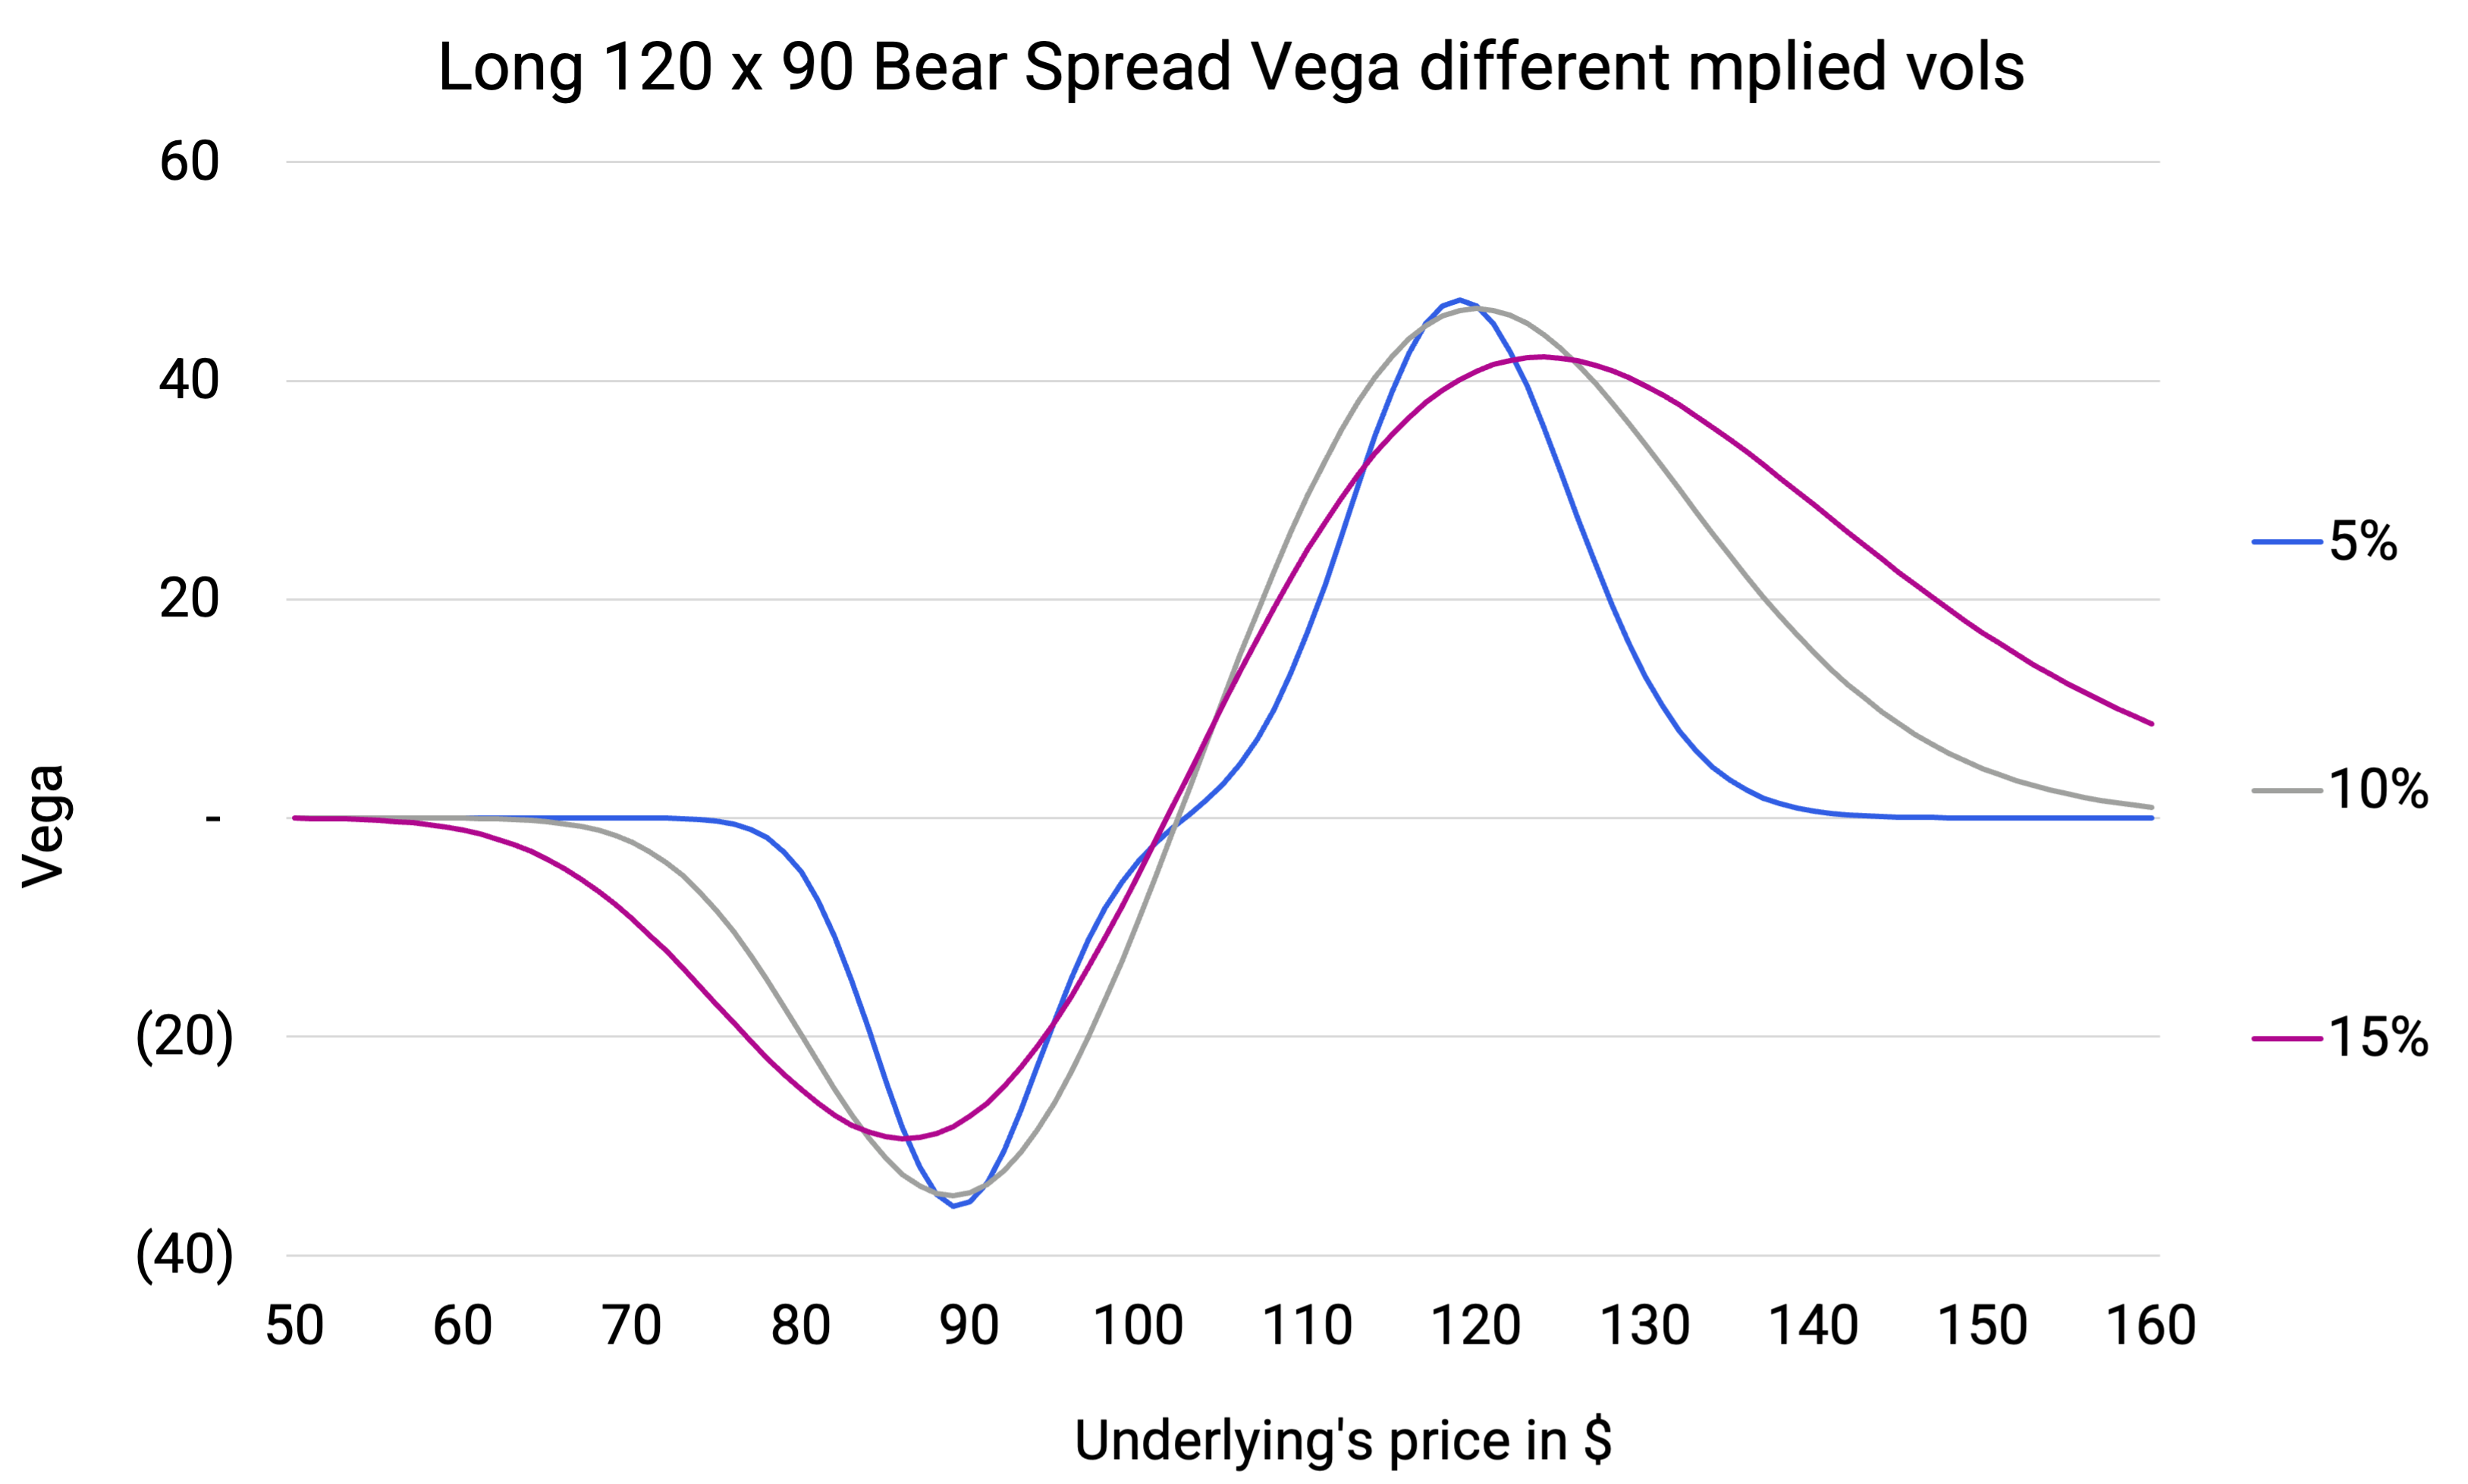
Implied vs Realised Vol - an extensively used term for the options world and one that crucially determines an option’s price...
As a concept means neutralising the sensitivity of an option’s price due to change in the price of the underlying stock.
Hedging and valuation of the option portfolio also crucially depends on the vol model assumptions...
While it's hard to lay out watertight rules for structuring strategies (as markets can throw unimaginable circumstances)...
This is a cheaper variation of a straddle that involves going long an OTM put and an OTM call again usually structured...
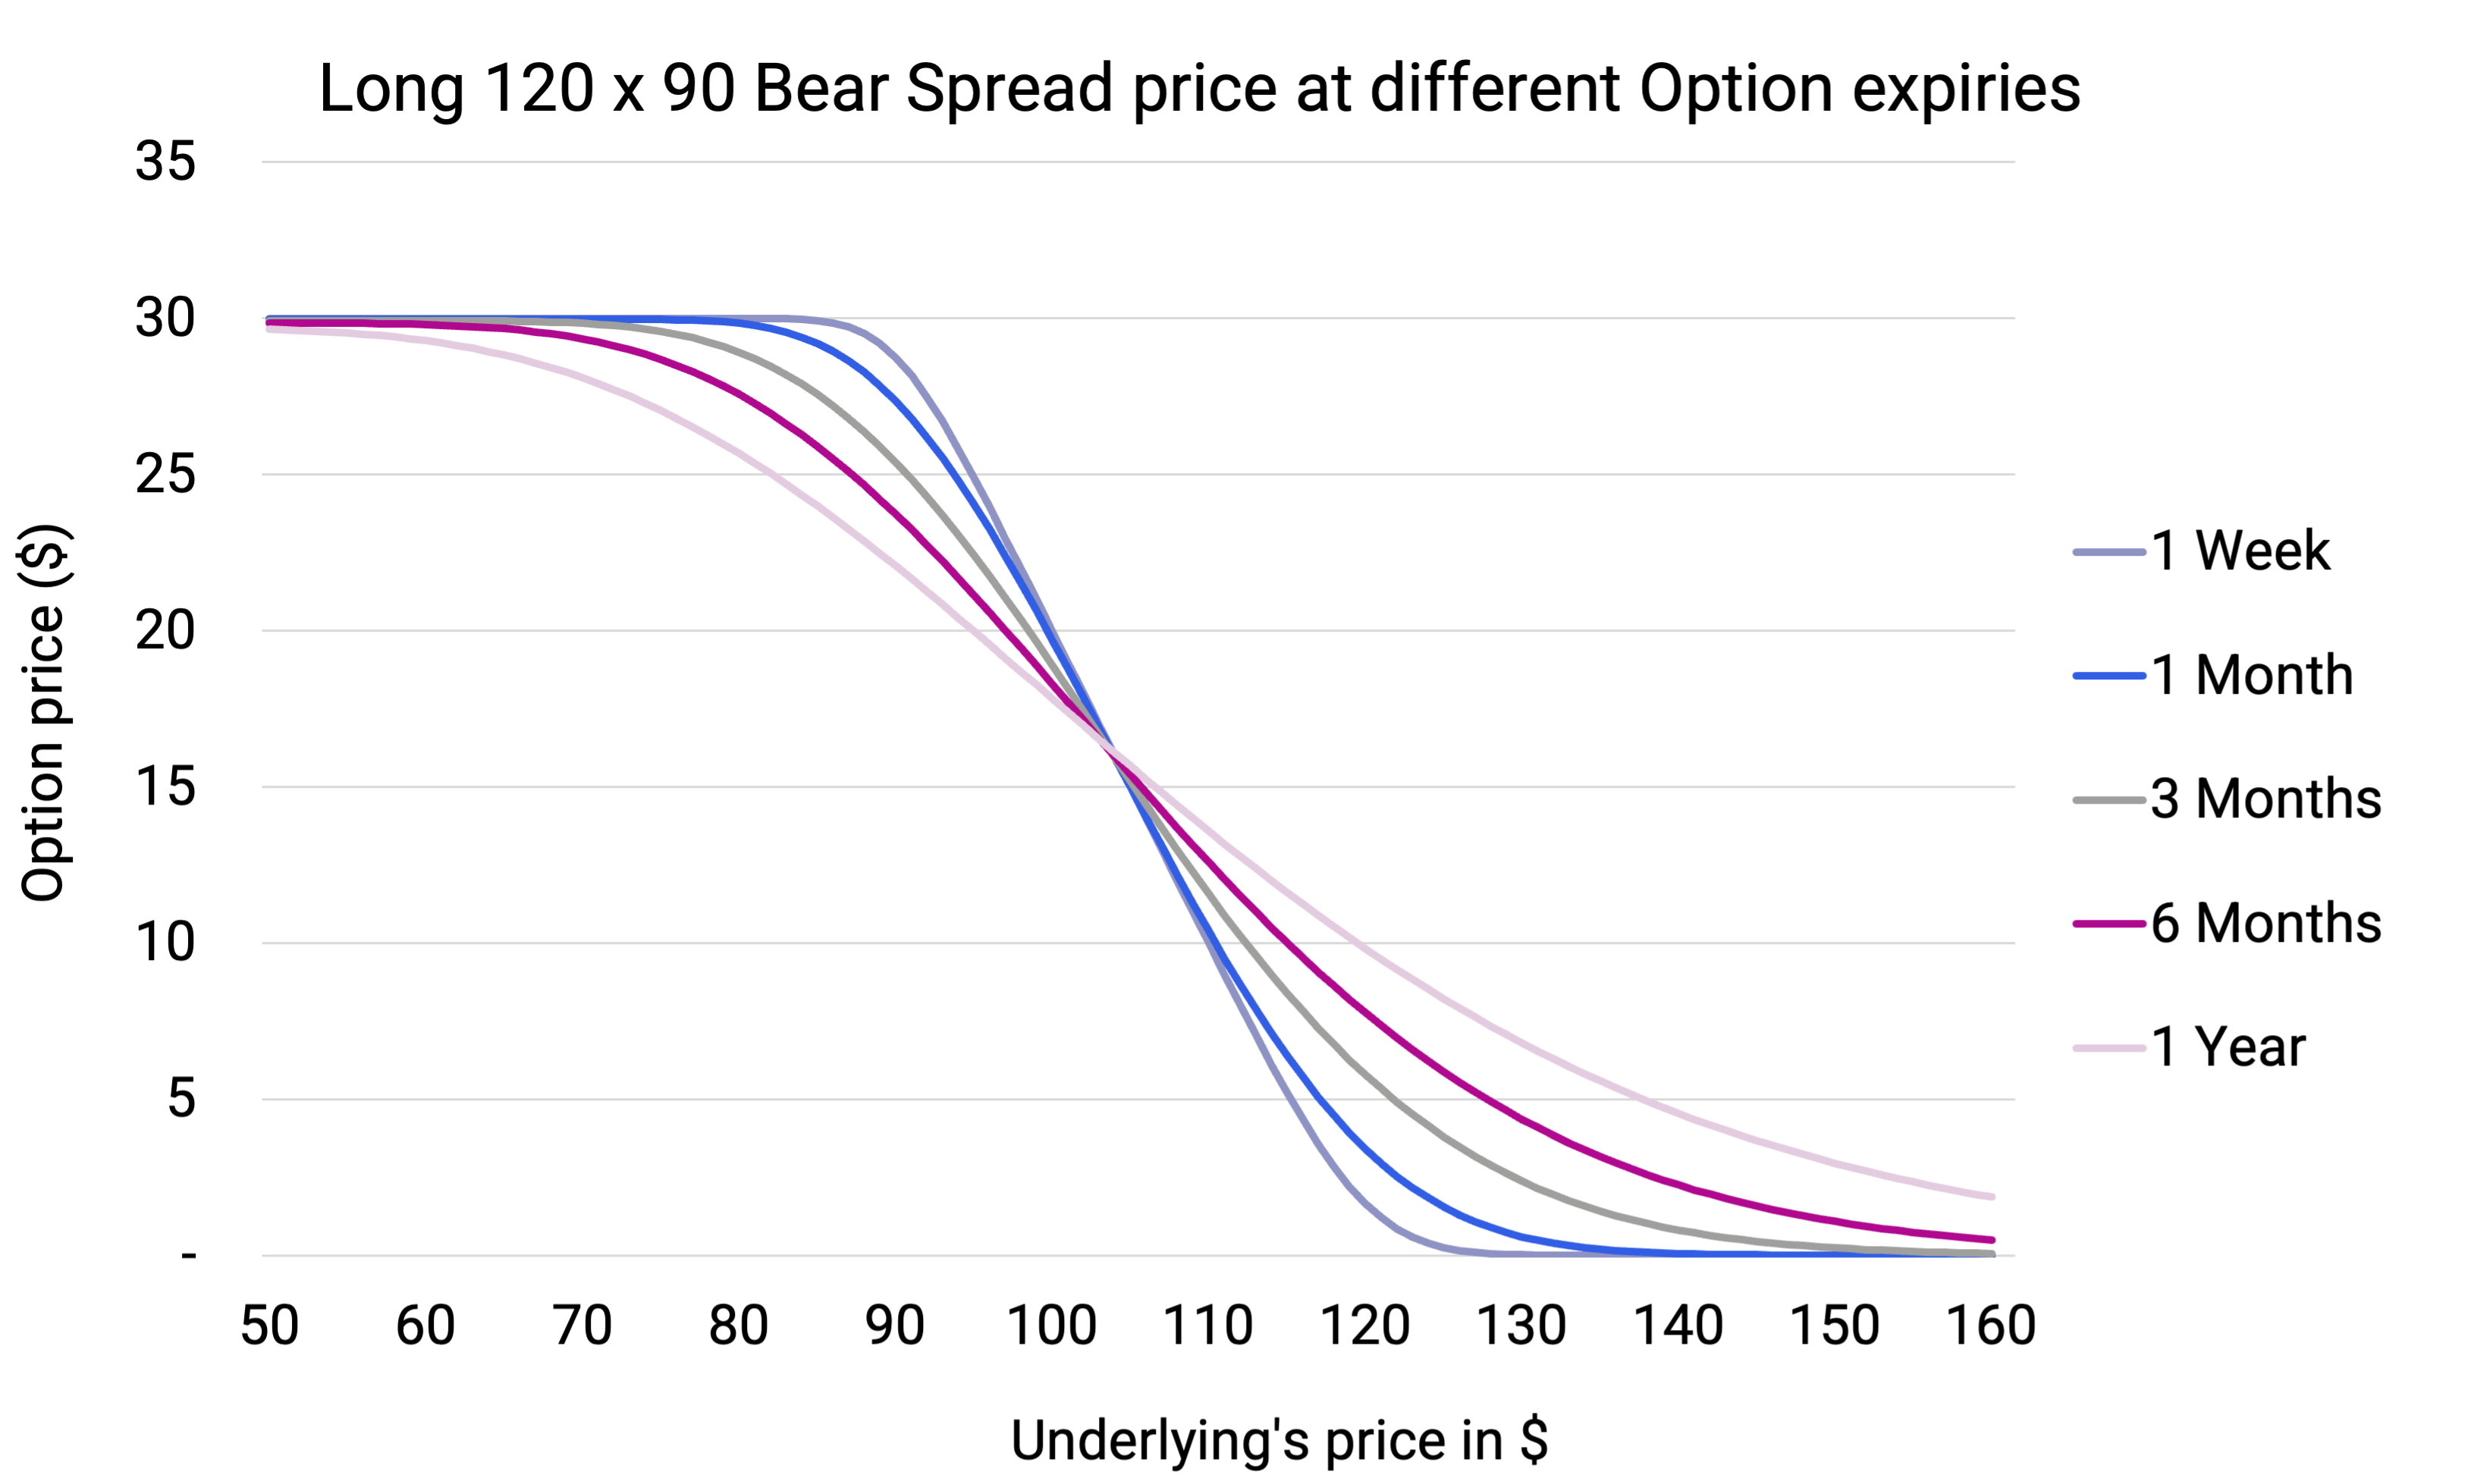
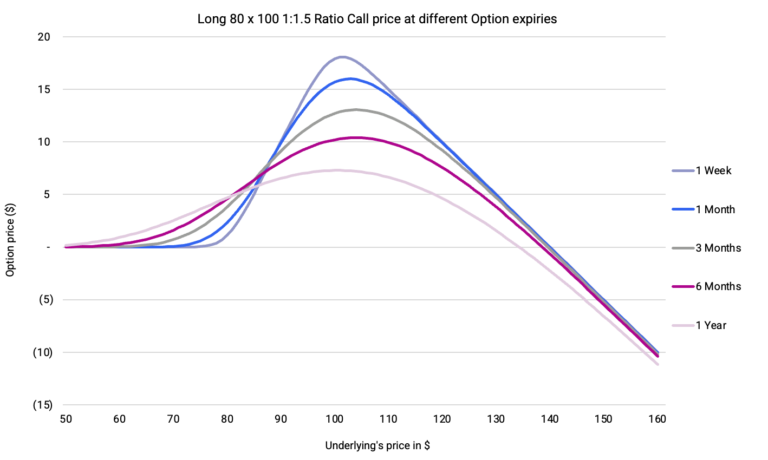
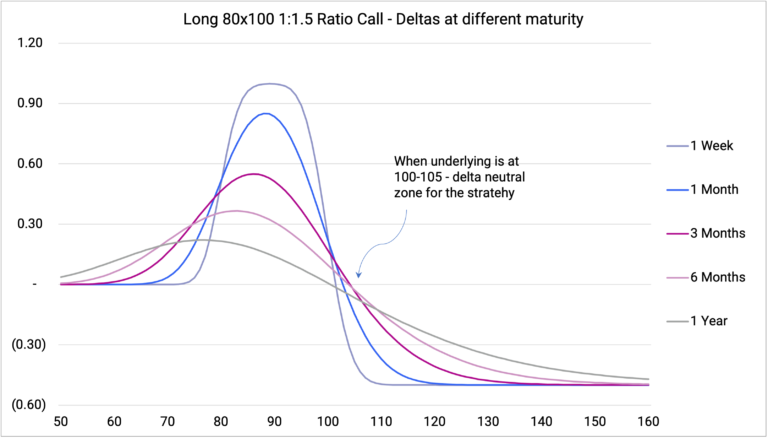
Generally structured as buying a lower strike (base case at the money) call and selling a higher strike...
Is a strategy to go short time decay by selling a shorter expiry option and buying a longer expiry one...
Risk reversals involve either selling an OTM Put and Buying an OTM call or Buying an OTM Put and Selling an OTM call...
A long butterfly spread involves buying a call (i.e. a call fly) each at a lower strike and higher strike while selling 2 calls...
Are a binary payoff strategy - i.e. payoff is either zero or the notional of the trade - conditional on the underlying’s price trading...
These options officially fall in the realm of structured products as they can be understood as a combination of at least two different options...
You cannot copy content of this page